How to test and troubleshoot WordPress plugins and themes
I spoke at WordCamp Atlanta last week. My presentation, Testing and Troubleshooting WordPress Plugins and Themes, is the culmination of three years leading quality at 8BIT.
Here's the full presentation, with cliff notes and resource links for each slide.

- I live in Des Moines, IA.
- I'm a frontend developer for John Deere.
- My website is manovotny.com.
- Follow me on Twitter at @manovotny.

- I've been working for 8BIT for three years.
- I oversee quality, testing the integrity of our products before they ship.

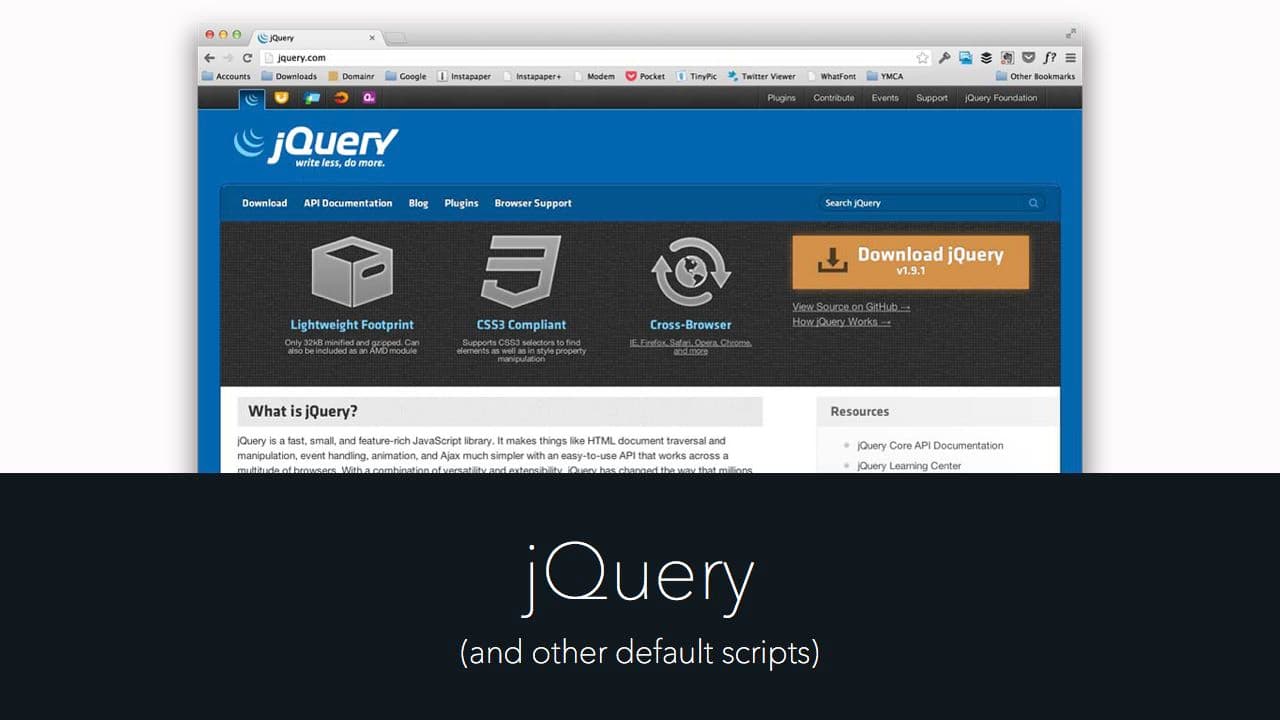
- Using jQuery properly prevents most theme issues, and especially plugin issues.
- Don't add your own version of jQuery.
- Don't deregister the version of jQuery that comes with WordPress.
- To use jQuery, enqueue the version that comes with WordPress.
- jQuery is the most popular example, but WordPress includes several scripts — properly enqueue those versions instead of using your own.
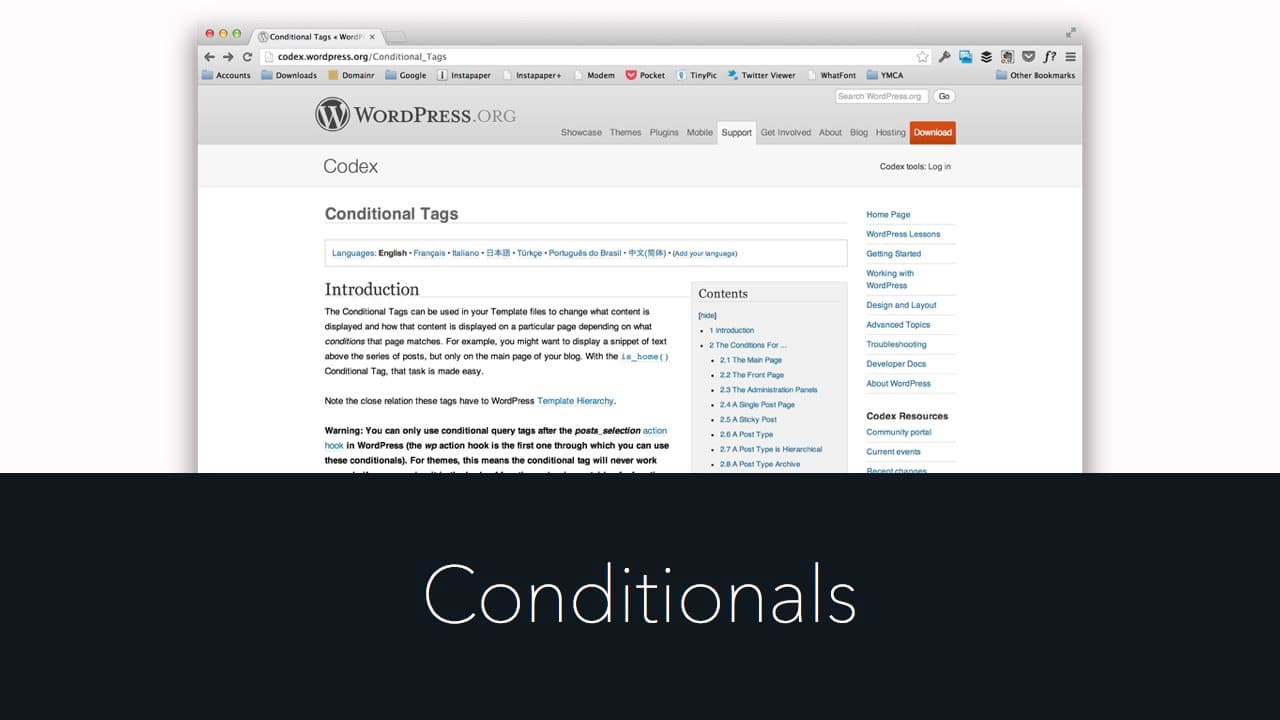
- Use WordPress conditionals to load scripts only on pages that need them. Fewer scripts on a page means fewer chances of conflicts.
- For example, only load a widget plugin's CSS and JavaScript when that widget displays on the current page.
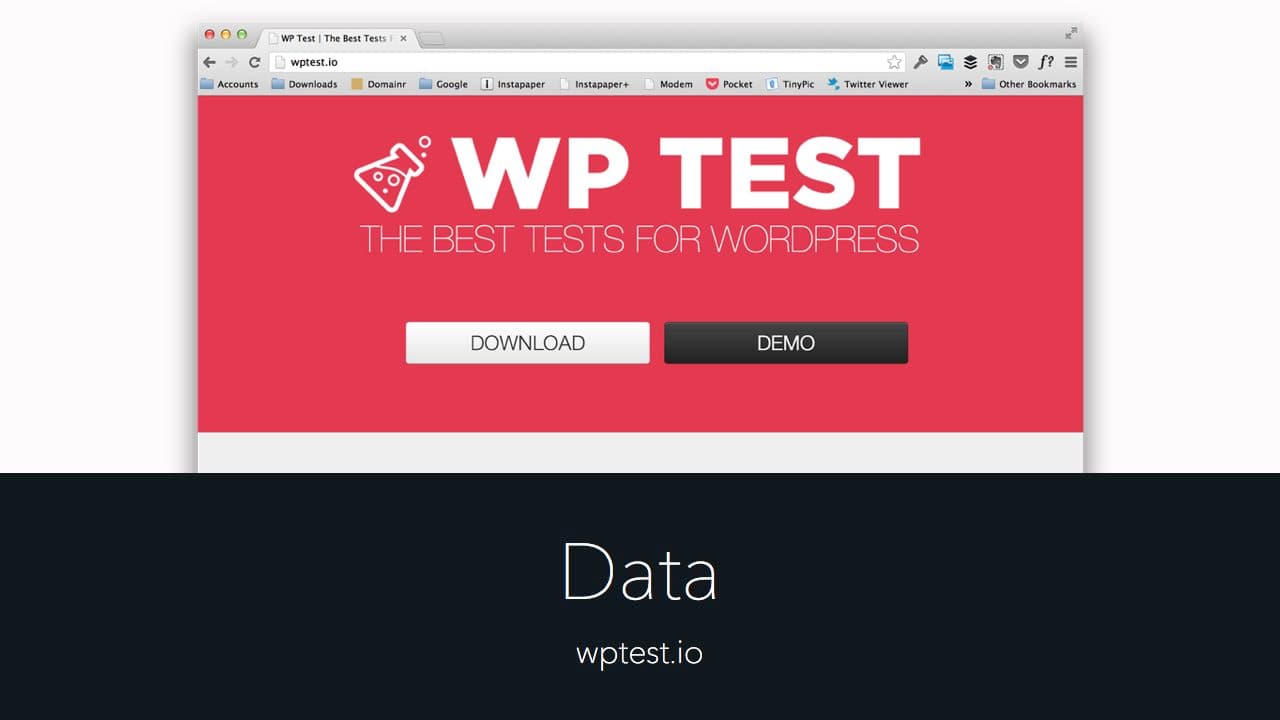
- I created WP Test to catch issues while developing WordPress themes and plugins.
- It's an exhaustive set of test data to measure the integrity of your plugins and themes.
- Over three years of theme and plugin support, and its baffling corner cases, distilled into a potent cocktail of quirky, simulated user content.

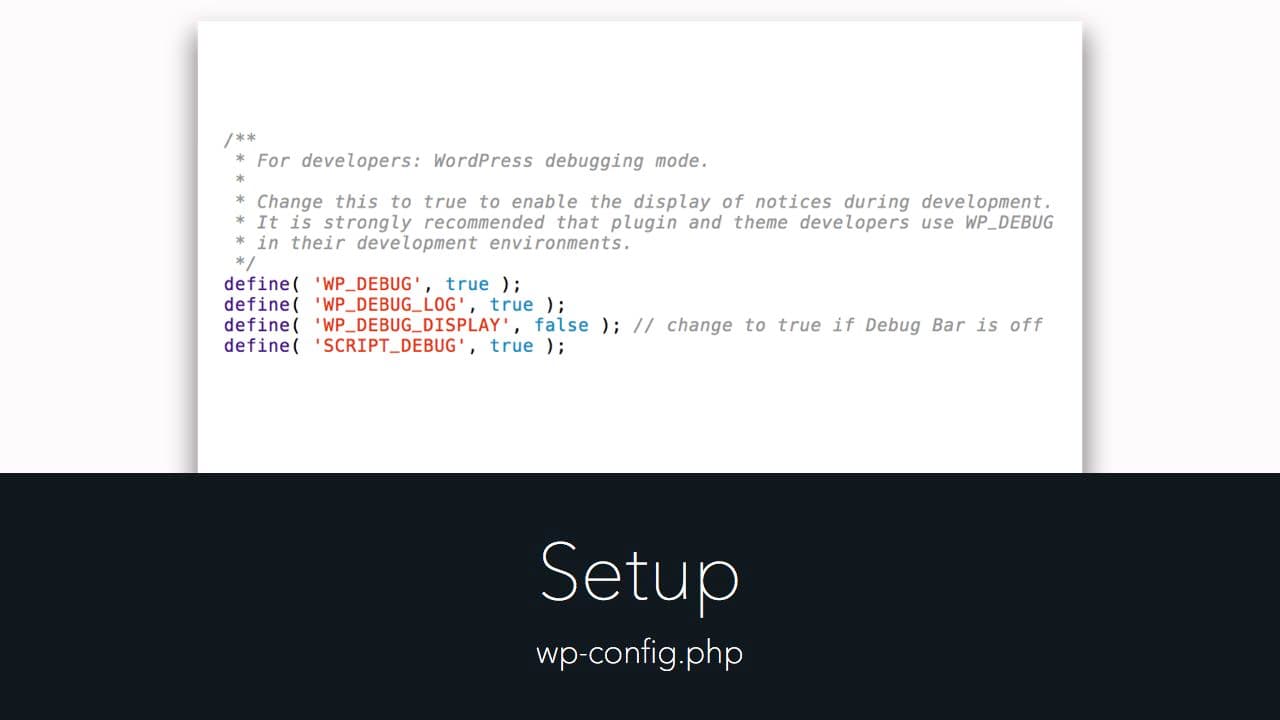
- In development environments, tell WordPress to log and report errors so you can fix them.
- Open your
wp-config.phpfile, at the root of your WordPress installation.
/**
 * For developers: WordPress debugging mode.
 *
 * Change this to true to enable the display of notices during development.
 * It is strongly recommended that plugin and theme developers use WP_DEBUG
 * in their development environments.
 */
define( 'WP_DEBUG', true );
define( 'WP_DEBUG_LOG', true );
define( 'WP_DEBUG_DISPLAY', false ); // change to true if Debug Bar is off
define( 'SCRIPT_DEBUG', true );
@ini_set( 'display_errors', 0 ); // Hide errors from being displayed on screen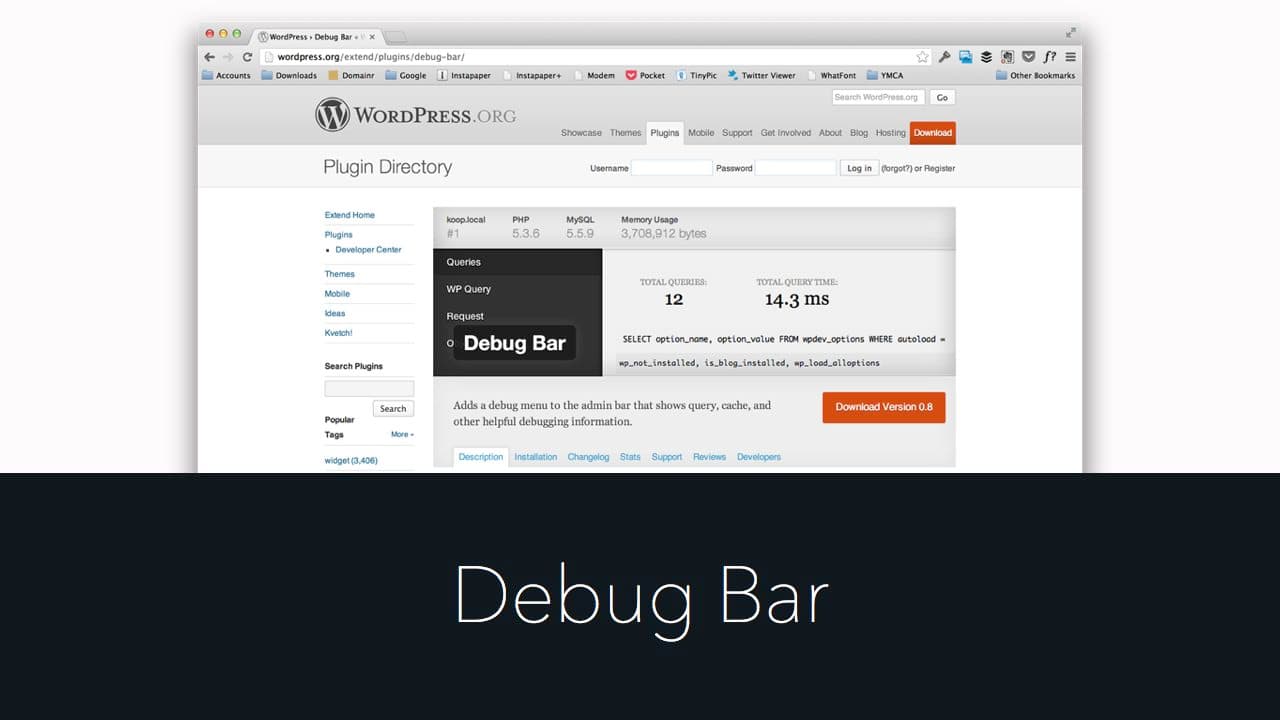
- Debug Bar adds a debugging menu to the admin bar that shows query, cache, and other debugging information at a glance.
- A useful way to see the errors being logged and reported.
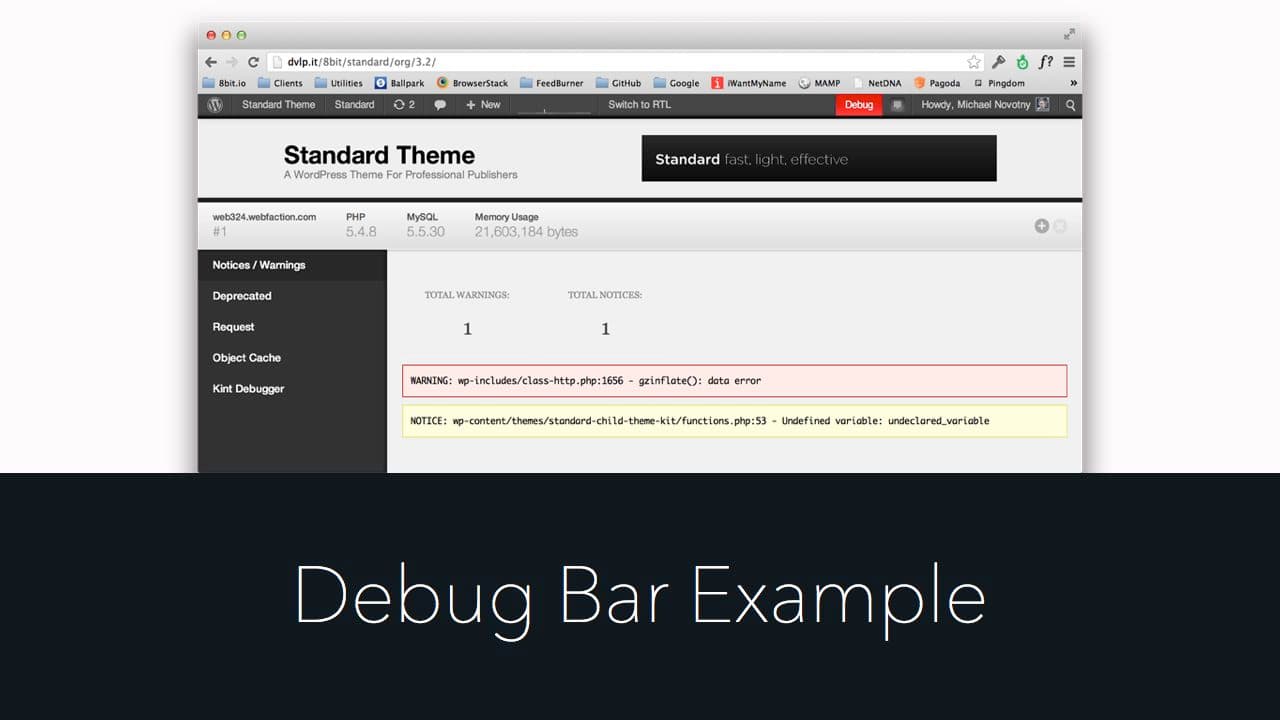
- The Debug button in the WordPress admin bar turns red when there's an error or warning.
- Click it to open the Debug Bar panel.
- Read the messages it reports so you can fix them.
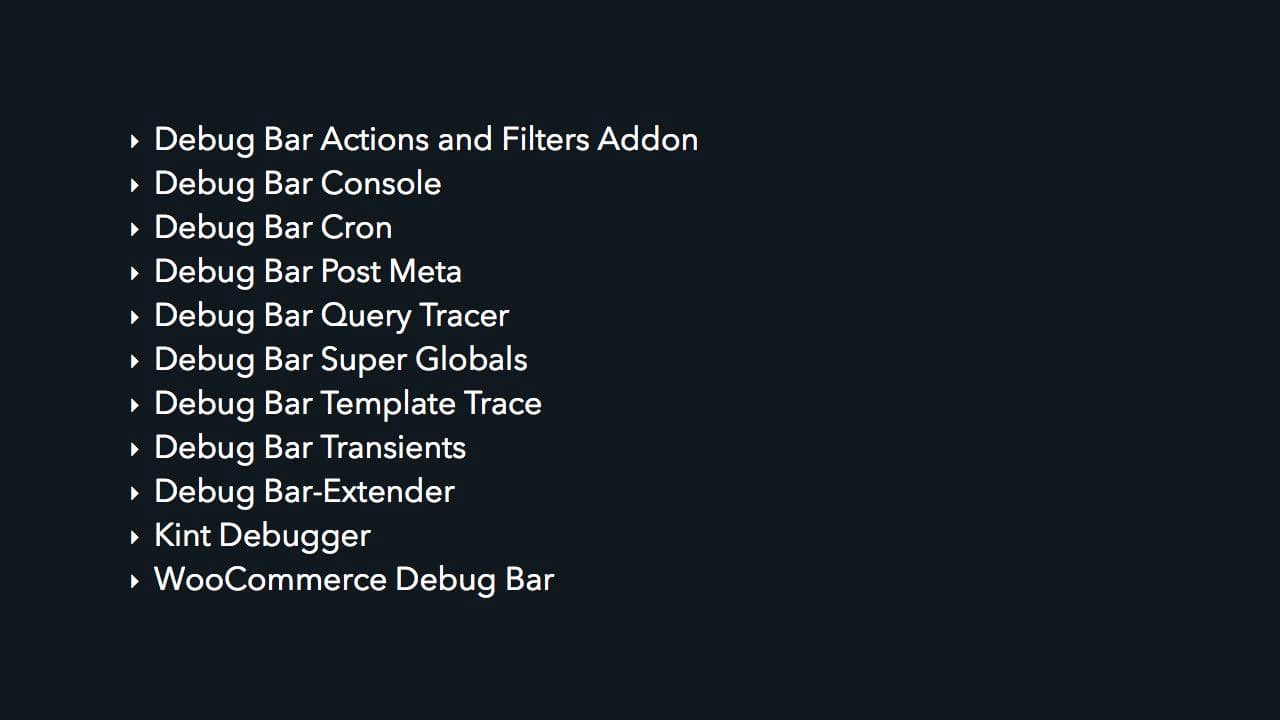
Many Debug Bar extensions give a deeper view into what's happening:
- Debug Bar Actions and Filters Addon
- Debug Bar Console
- Debug Bar Cron
- Debug Bar Post Meta
- Debug Bar Query Tracer
- Debug Bar Super Globals
- Debug Bar Transients
- Debug Bar-Extender
- Kint Debugger
- WooCommerce Debug Bar
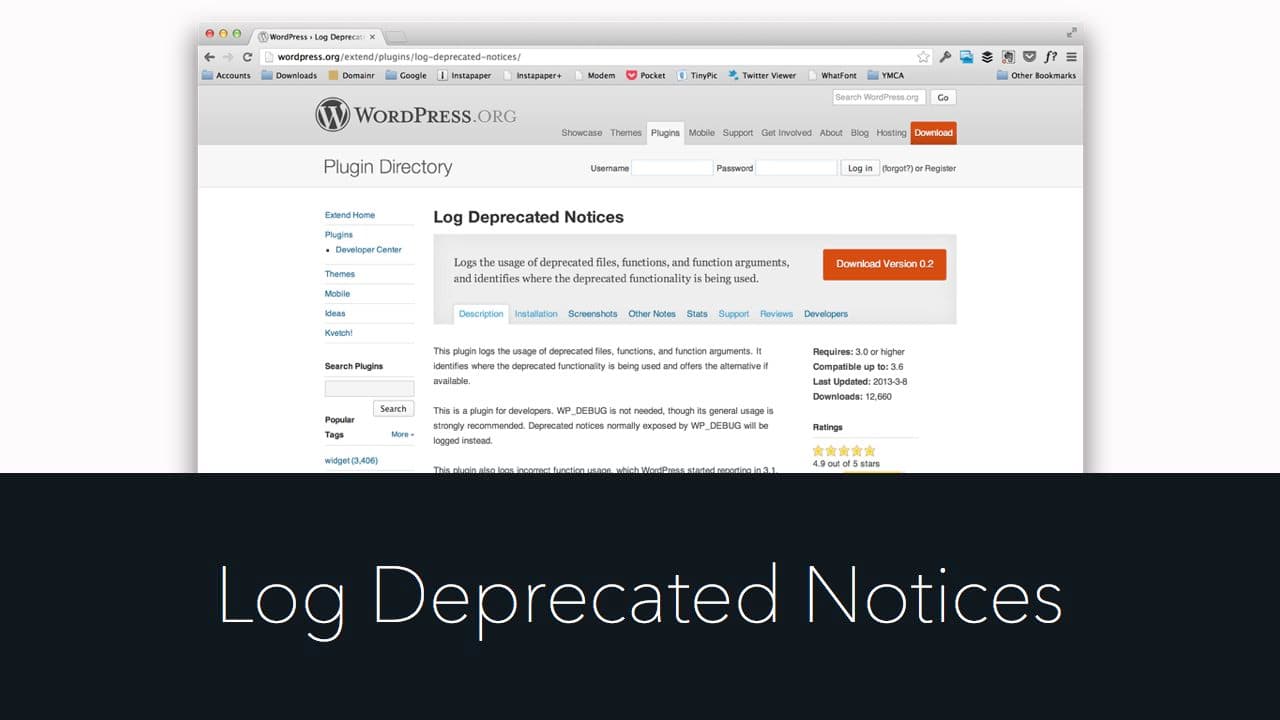
- Log Deprecated Notices identifies old WordPress API functions your theme or plugin uses so you can update to the newer methods.
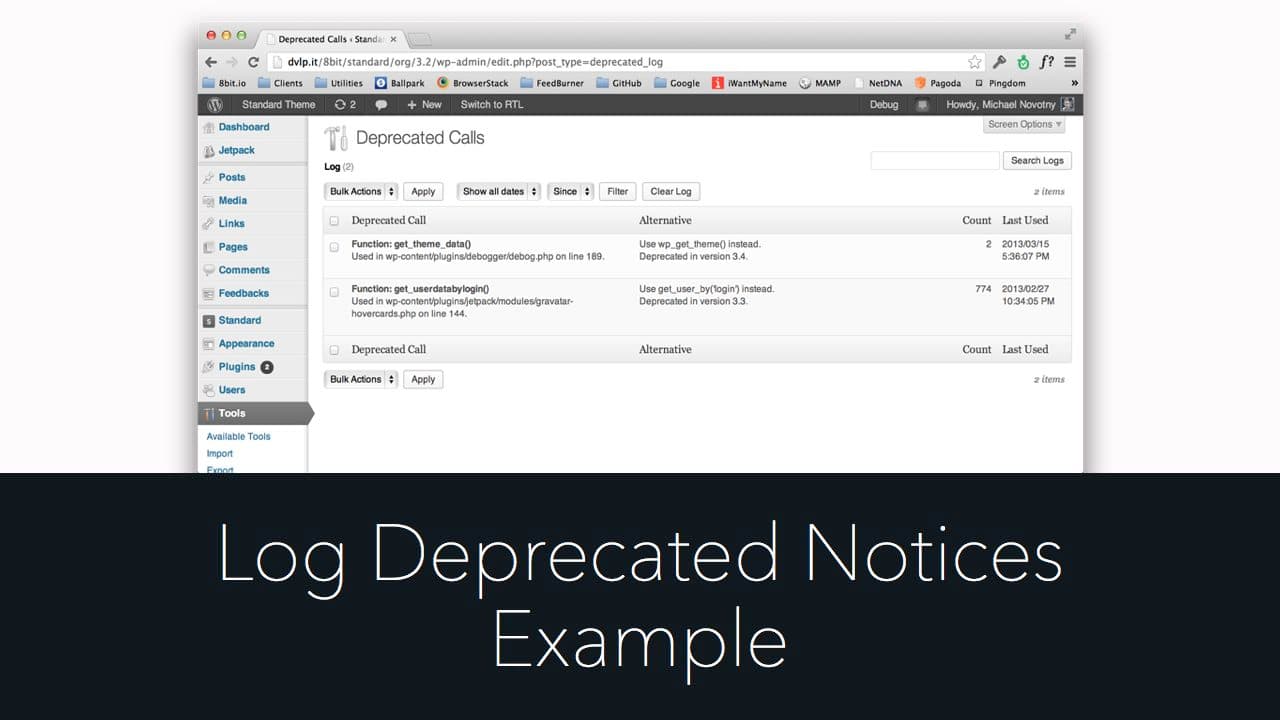
- Log Deprecated Notices logs its calls under the Tools menu in the WordPress admin.
- Sometimes themes or plugins keep deprecated calls anyway, especially to support older versions of WordPress — that judgment call is yours when they're reported.
- Whenever possible, stay current with the newer methods instead of keeping legacy support.
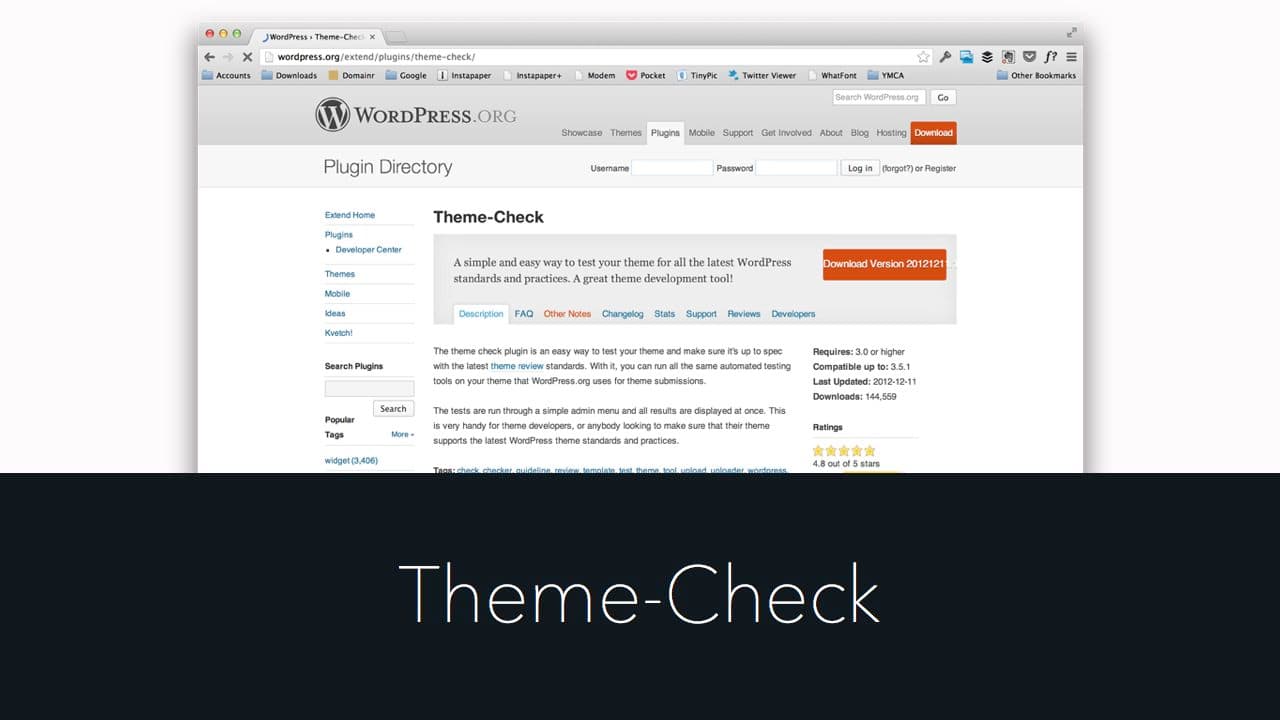
- Theme-Check tests your theme against the latest WordPress standards and practices.
- It lives under the Appearance menu in the WordPress admin.
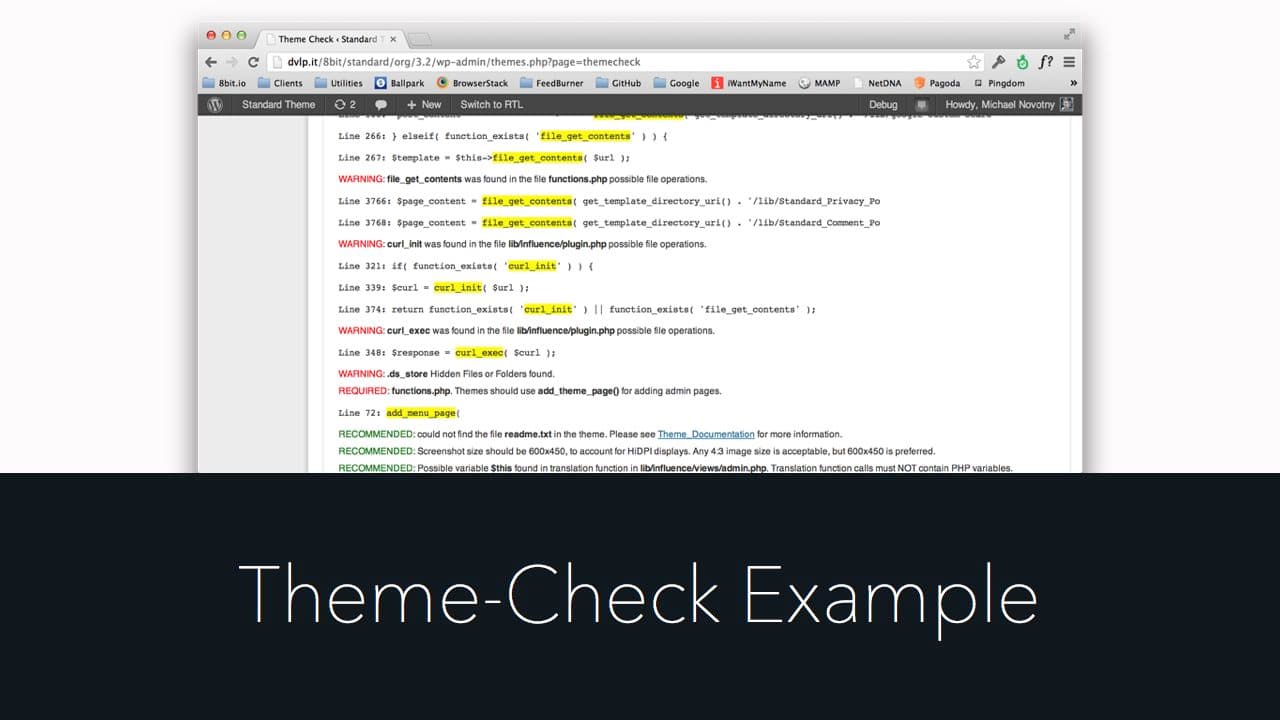
- Theme-Check reports false positives sometimes, so you'll need to decide whether each claim is legitimate and needs fixing.
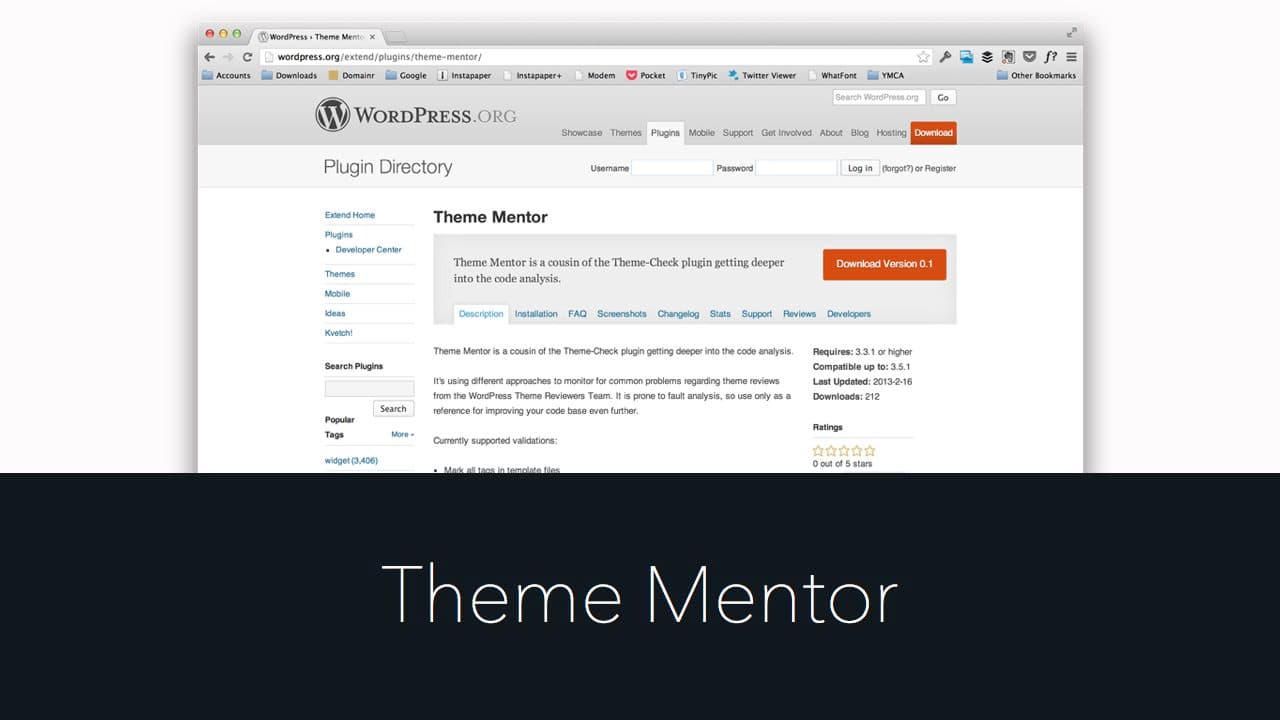
- Theme Mentor is the cousin of the Theme-Check plugin.
- It runs deeper code analysis for best practices, like checking for the jQuery dequeueing we covered above.
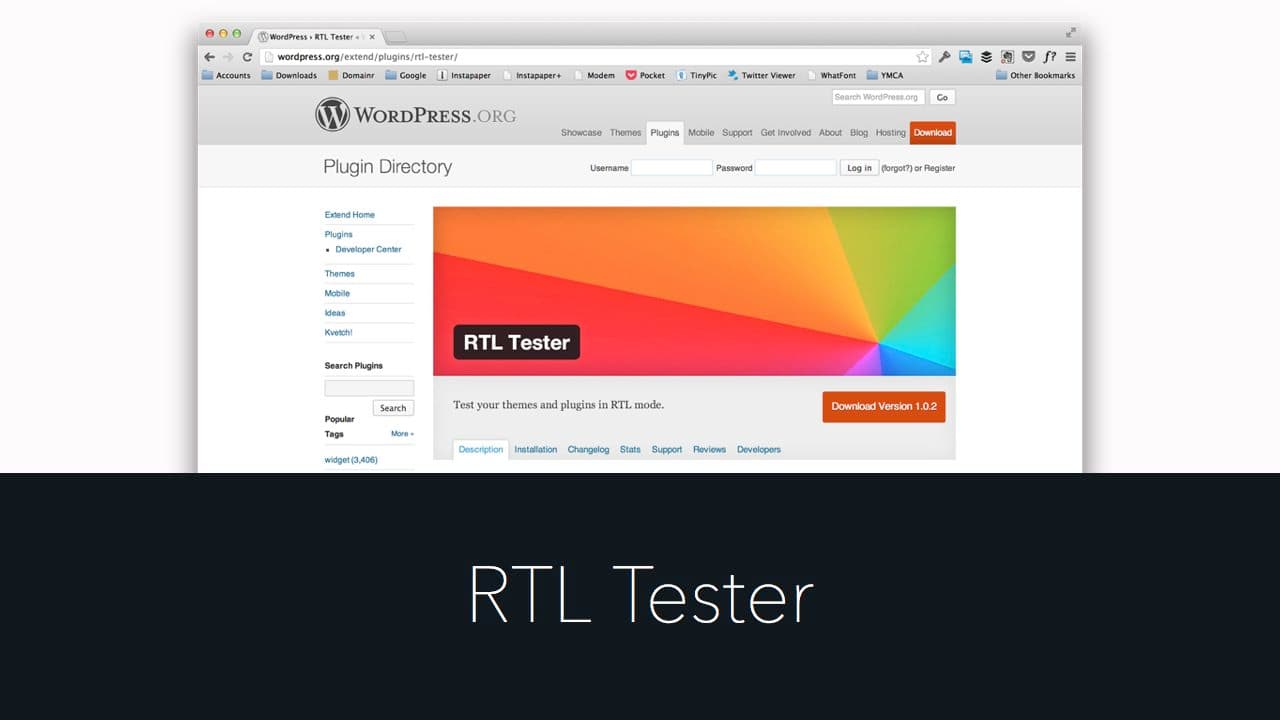
- RTL Tester is essential for troubleshooting plugins and themes that support right-to-left reading languages.
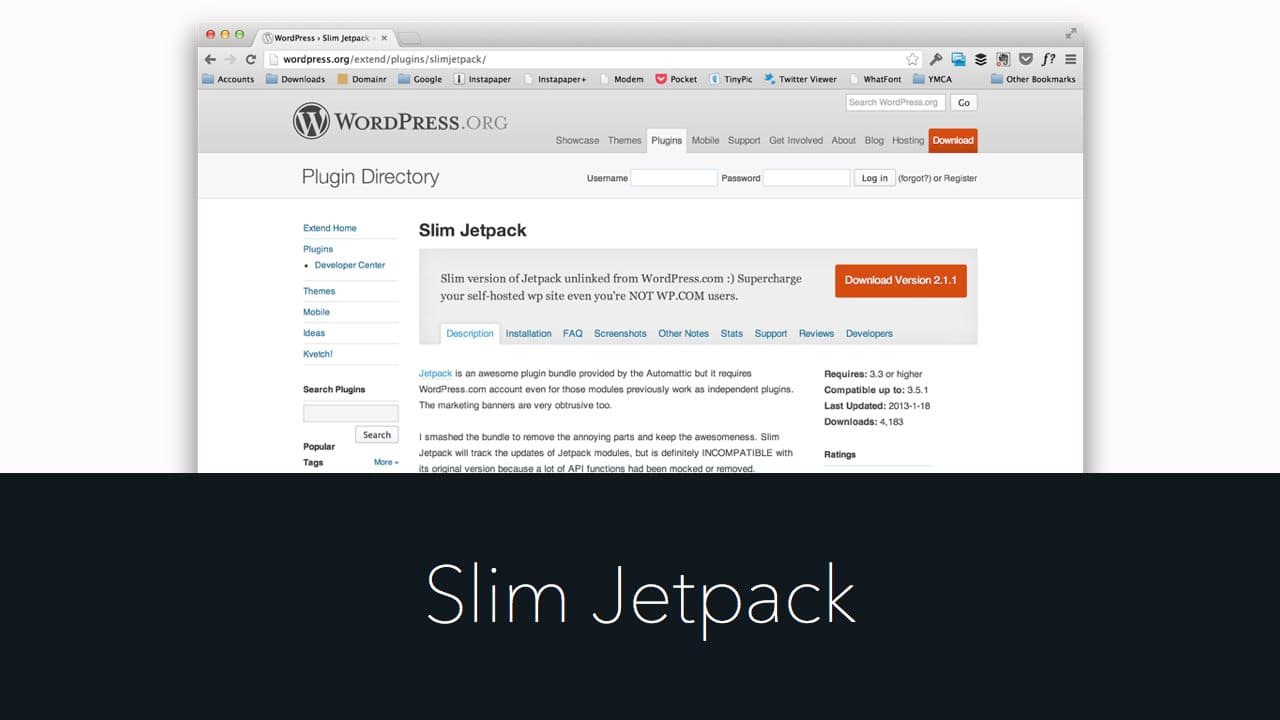
- Slim Jetpack is Jetpack without the connection to a WordPress.com account.
- Handy for development environments that don't need the WordPress.com connection to test Jetpack features.
- Someone in the Q&A session mentioned that Jetpack now ships with a "Developer Mode" that drops the WordPress.com connection requirement in development environments. Add the code below to
wp-config.phpto enable it.
define( 'JETPACK_DEV_DEBUG', true );
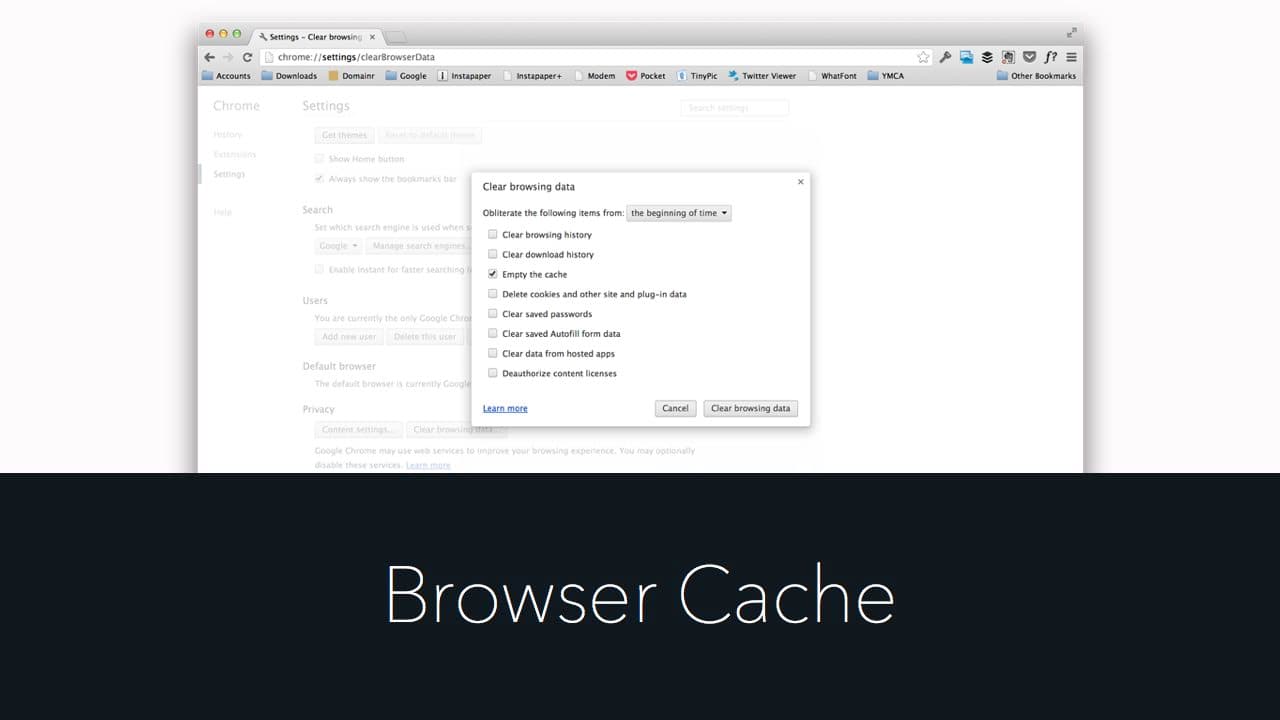
- At some point in your development career, browser cache will bite you.
- If changes to your CSS and JavaScript files aren't showing up, clear your browser cache.
At 8BIT we use process of elimination to find where a failure starts:
- If things aren't working, we disable all plugins first to see if that resolves the issue.
- If things start working again, we enable plugins one by one until the issue reappears. That's our culprit, and we can start troubleshooting the plugin.
- If plugins aren't the issue, we switch to a default WordPress theme like TwentyEleven or TwentyTwelve. If the issue goes away, it's a theme problem we need to resolve.
- If neither plugins nor themes are causing the issue, it's WordPress core or a server configuration issue.
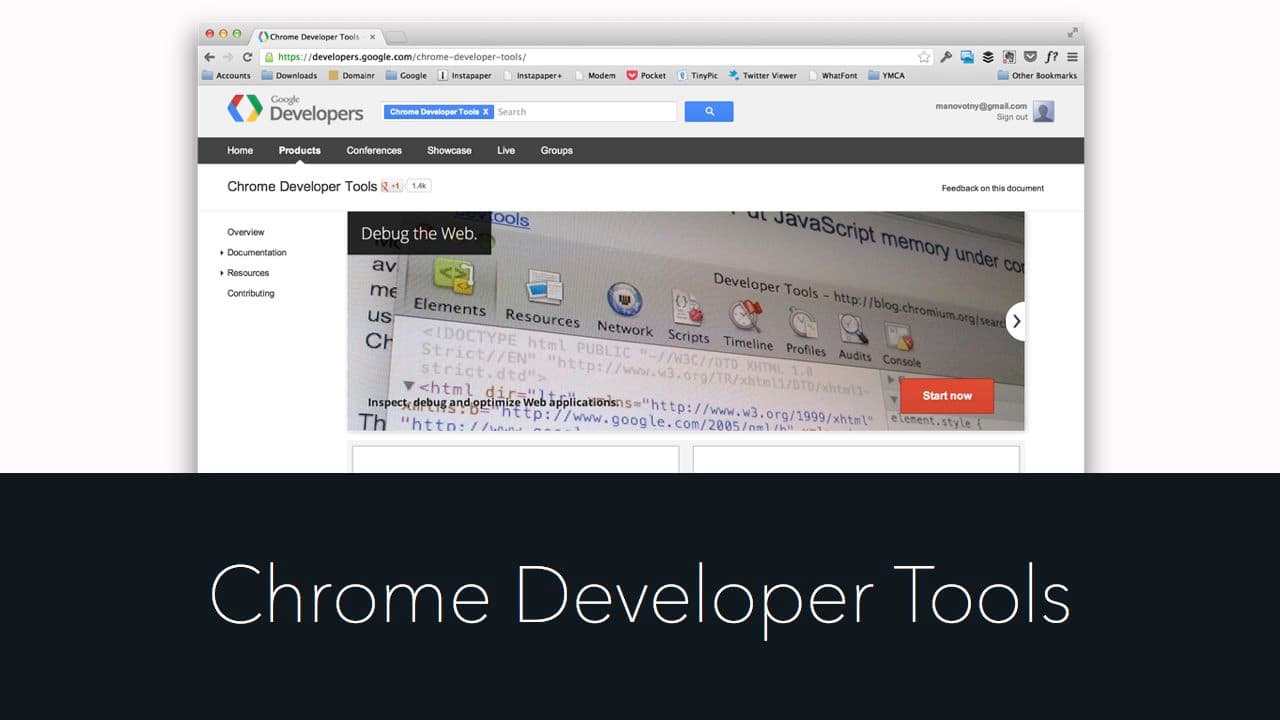
- Chrome DevTools is the most advanced way to inspect what's going on under the covers of your website.
- The Firebug extension / add-on is a good alternative for other browsers, though it isn't as capable as Chrome Developer Tools.
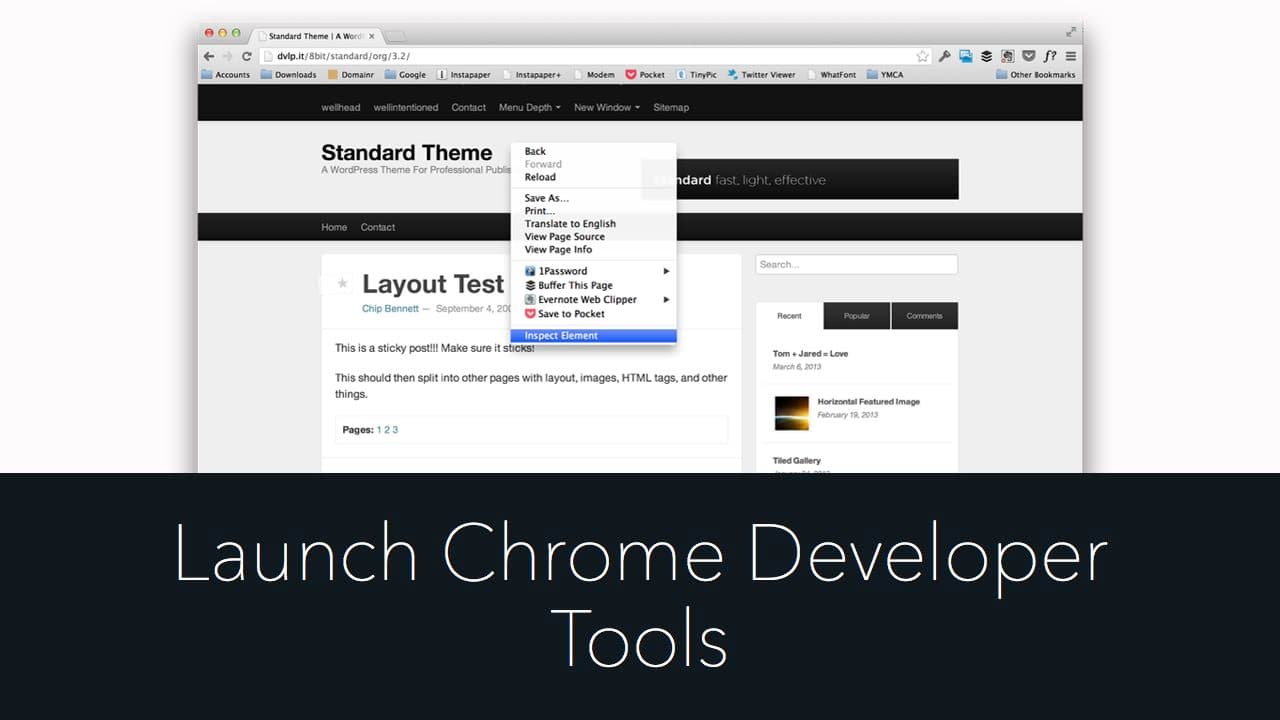
- Open Chrome Developer Tools by right-clicking anywhere on the website and selecting Inspect Element.
- A panel opens at the bottom of your browser. You can change the position — mine's on the right.
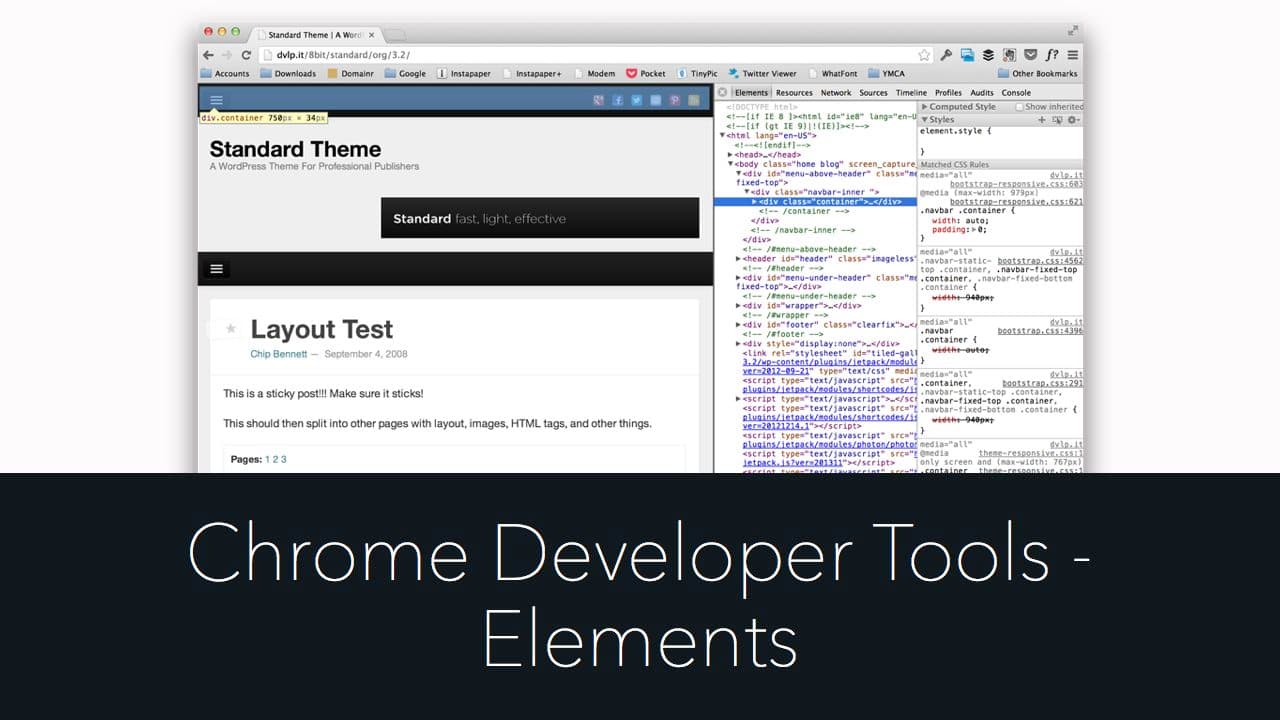
- The Elements tab contains the markup and CSS for the current page. Select an element to see the CSS being applied, the selector causing it, and the load order. CSS properties and values are editable for live changes.
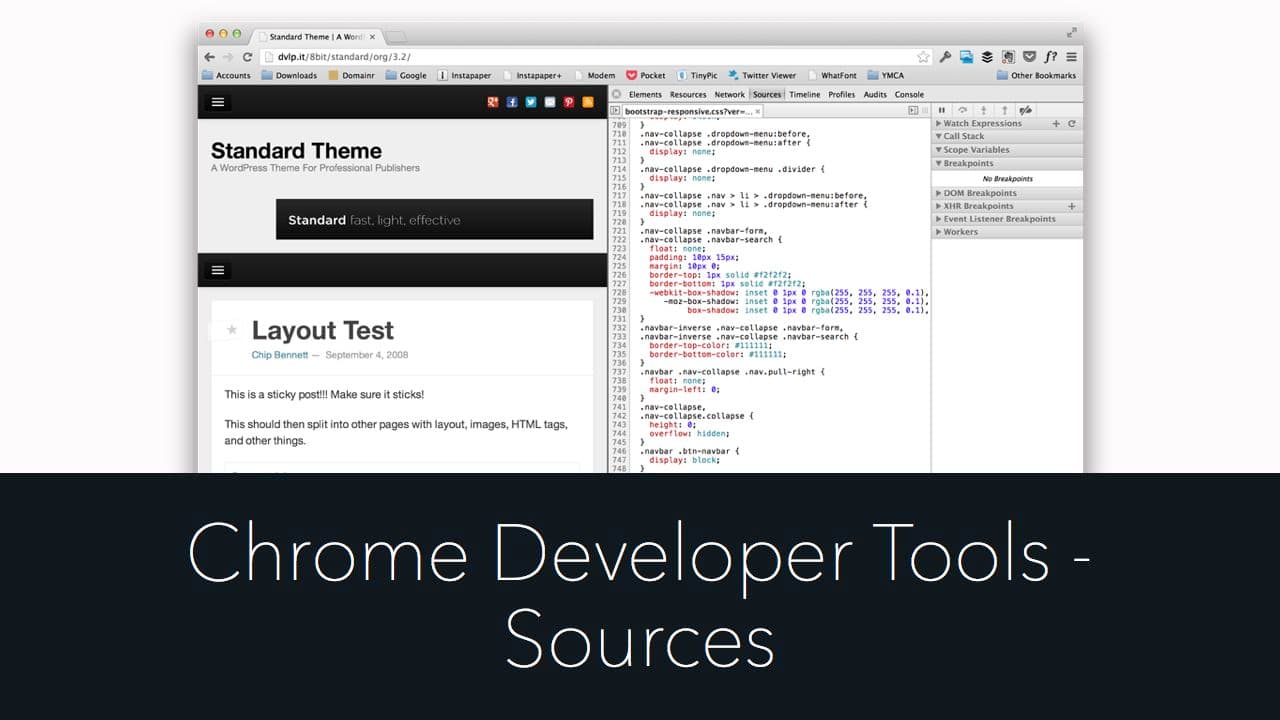
- The Sources tab shows all CSS and JavaScript files loaded as part of the page. File content can be edited live. Set breakpoints by clicking a line number.
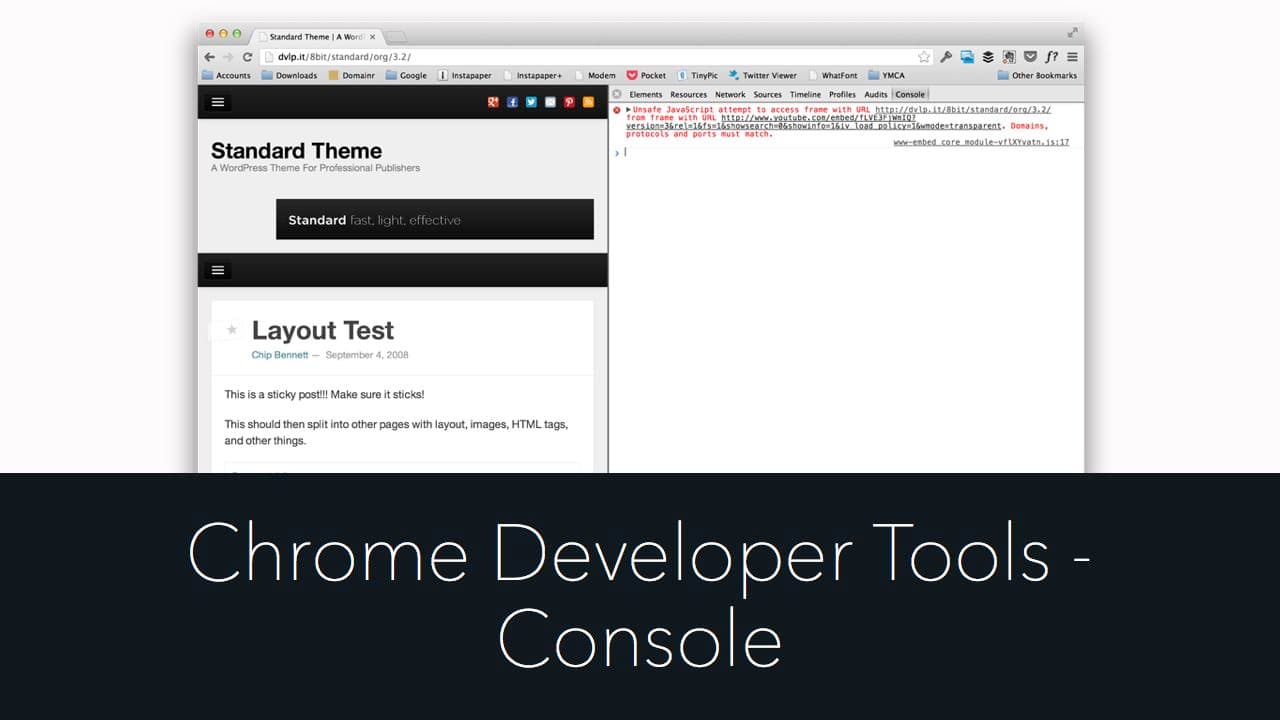
- The Console tab lets you run JavaScript and shows any errors the site throws. For troubleshooting, use it to see if the site is throwing errors. Keep it open at all times during testing.
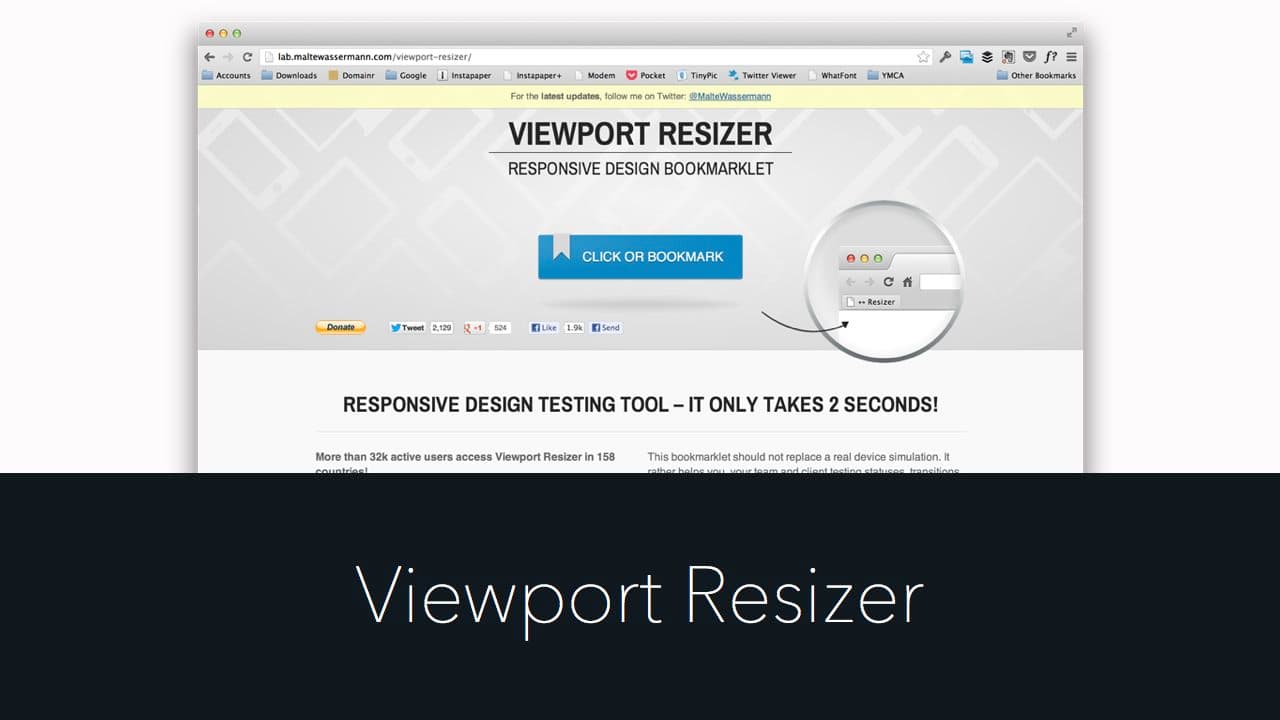
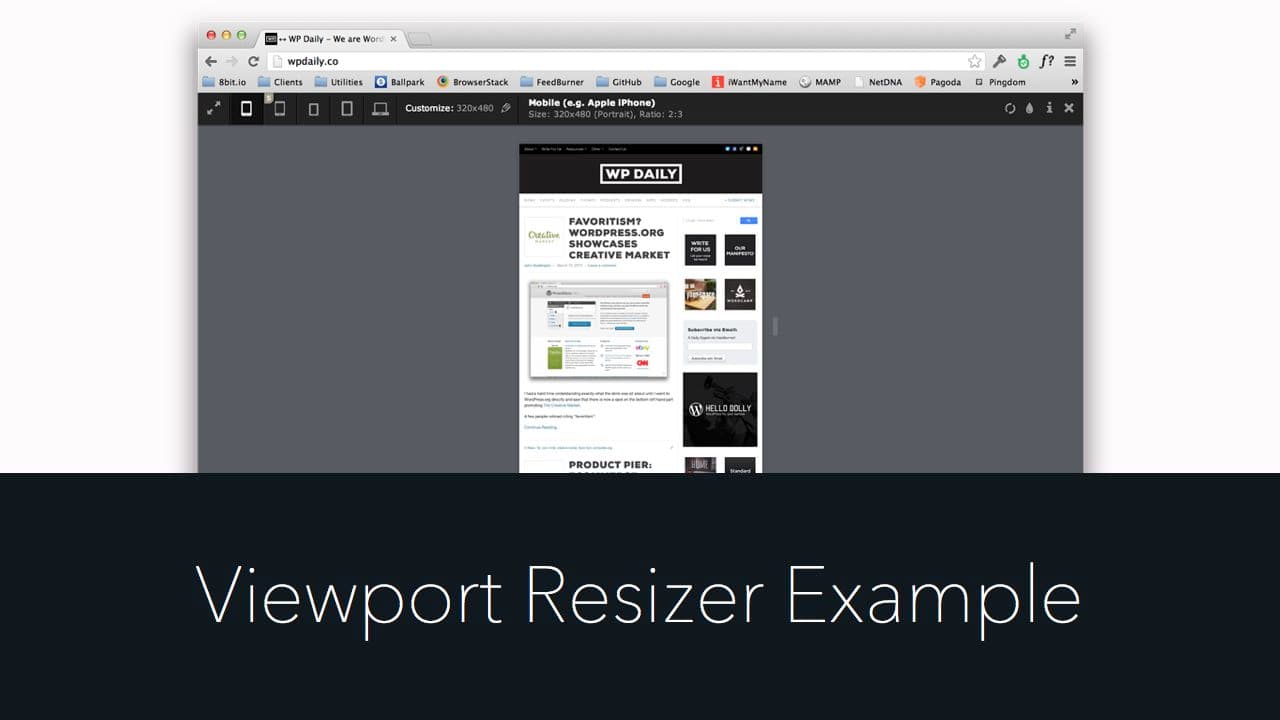
- Viewport Resizer is a handy bookmarklet that loads your site in viewports sized to common devices. Helpful for testing responsive design.
- Someone in the Q&A session also recommended the Web Developer extension as an alternative that properly displays websites with the correct user agents.
Using the Chrome DevTools Toggle device toolbar is a better approach now.
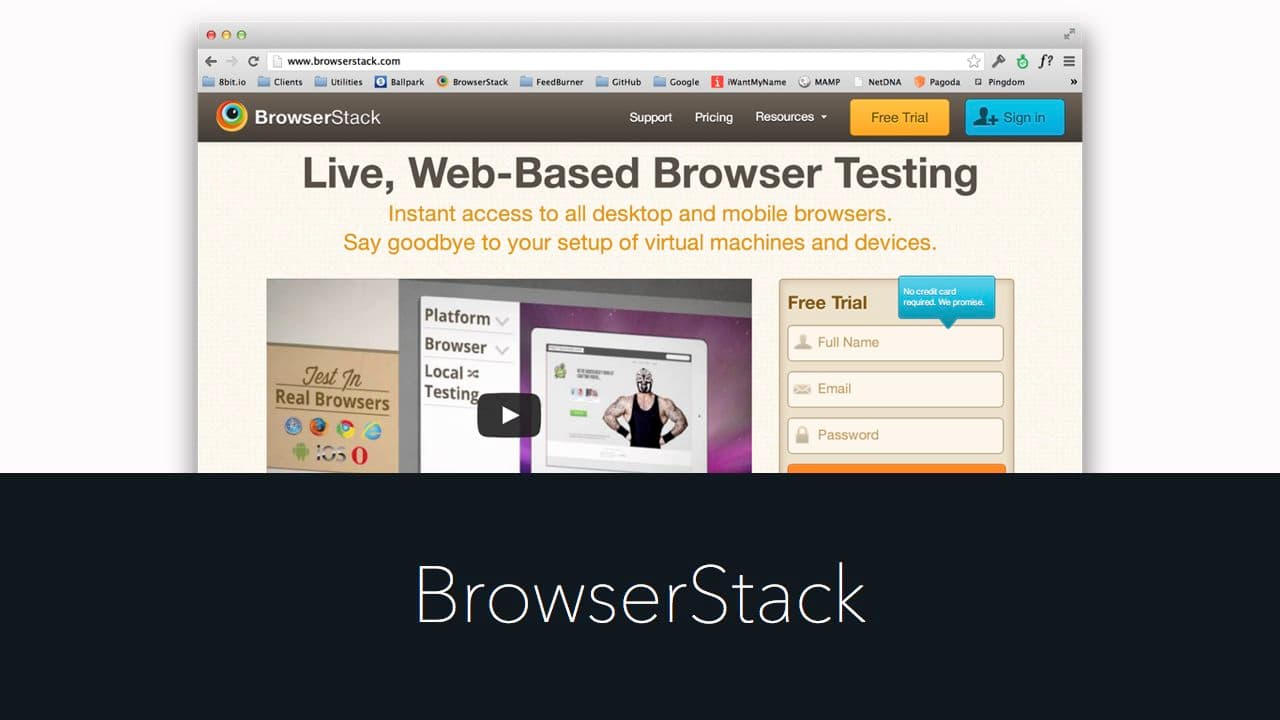
- BrowserStack is a paid service that lets you test your website on all browsers, devices, and operating systems. It comes with built-in debugging tools.
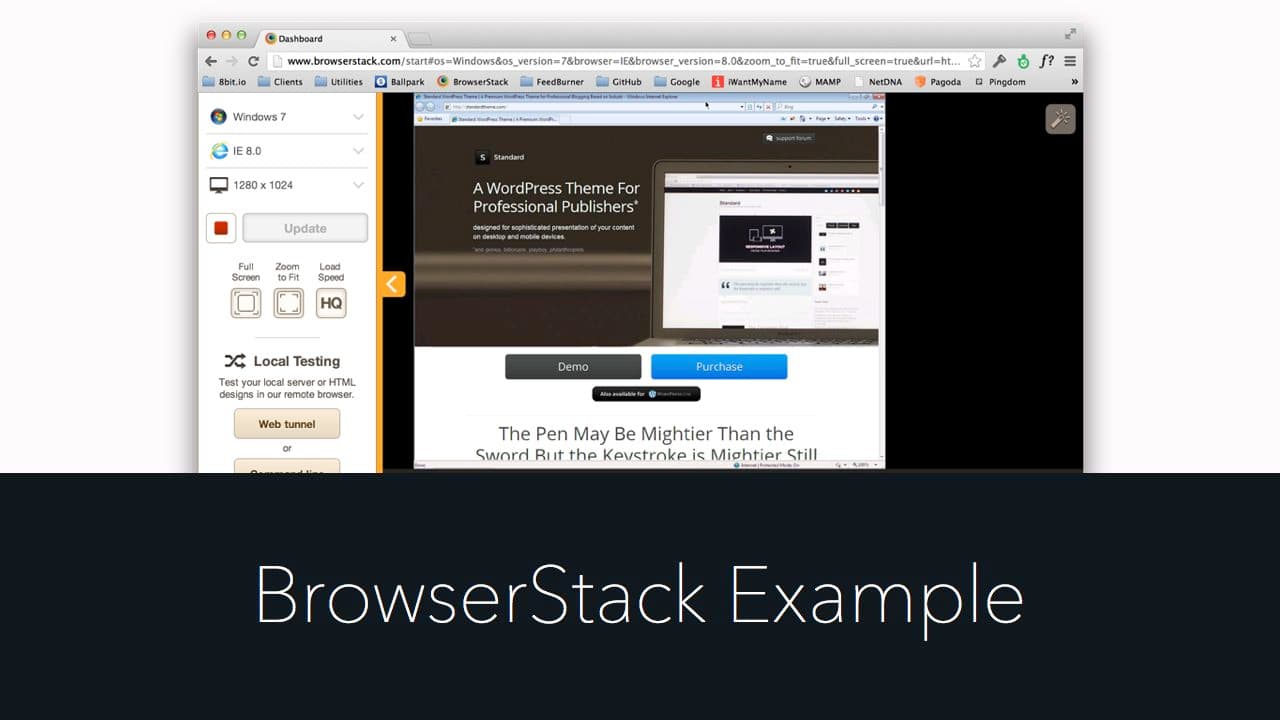
An example of a website in IE 8 running on a Windows 7 machine all from within my browser. The websites are fully interactive, not just screenshots.
- Someone in the Q&A session also mentioned using Web Inspector to debug Mobile Safari if you have a Mac: pair Xcode's iPhone/iPad simulator with Safari's Web Inspector to debug, or plug in your iPhone / iPad via USB and use Safari 6 to live-debug webpages on your device.
You can download the slides, watch my session, or watch all the other WordCamp Atlanta 2013 sessions.
A special thanks to Jared Erickson for making our team look united in our presentations. The guy can make anything look good — even slides.
And thanks to everyone who attended my talk and everyone who came to WordCamp Atlanta. Meeting you all face-to-face was a pleasure, and the conversations we had are priceless.